Image Details
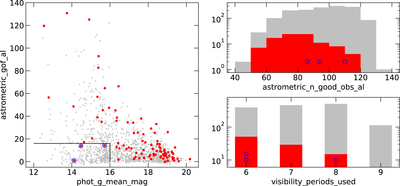
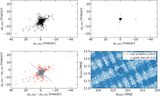
Caption: Figure 11.
Characteristics of Gaia DR2 sources with systematic errors. Filled circles in red and gray correspond to the selected outliers and the rest in the bottom left panel of Figure 10, respectively. Left panel: gof statistic as a function of magnitude. Black solid lines outline the quality-cut thresholds applied for our control sample in Section 4.1. Outliers that passed the cuts are marked with open circles in blue. Right panels: histograms of astrometric_n_good_obs_al (top) and visibility_periods_used (bottom).
Other Images in This Article
Copyright and Terms & Conditions
© 2019. The American Astronomical Society. All rights reserved.
Copyright ©
2024 Astronomy Image Explorer. All Rights Reserved.