Image Details
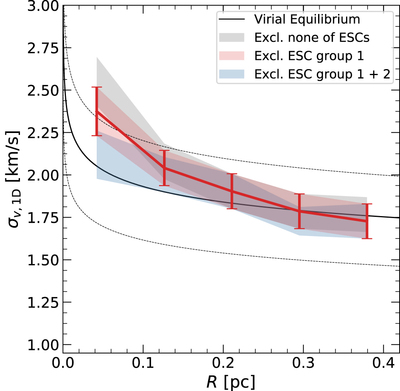
Caption: Figure 8.
Plot of the velocity dispersion ﹩{\sigma }_{v,1{\rm{D}}}﹩ vs. distance from the center of the ONC. The gray, red (with error bars), and blue confidence bands mark velocity dispersions based on the PM dispersions presented in Table 5 and the estimate for the distance of the ONC, 414 ± 7 pc (Menten et al. 2007). The black solid line illustrates the one-dimensional velocity dispersion for virial equilibrium predicted from the stellar and gas mass from Da Rio et al. (2014), and the dashed lines mark the uncertainty assuming a 30% mass uncertainty. Note that 0.3 pc corresponds to ∼2.′5 in radius.
Other Images in This Article
Copyright and Terms & Conditions
© 2019. The American Astronomical Society. All rights reserved.
Copyright ©
2024 Astronomy Image Explorer. All Rights Reserved.