

Image Details
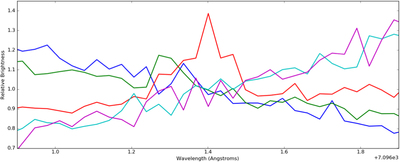
Caption: Figure 14.
Comparison of the wavelength profiles of six rows in the raw image in Figure 13 to show the lack of a peak in all but the central (red) row. Pixel values have been normalized by dividing the mean pixel value of the row segment displayed. If there were any light that had passed through the spectrometer in order to produce the peak seen in the central, red row, we should see some peak in the adjacent orders. The full width at half maximum of the spatial point-spread function is close to 2.5 pixels for a night of good (i.e., low) atmospheric seeing, as was the night on which this spectrum was taken. The eye can pick out no peaks in any of the adjacent orders.
Other Images in This Article
Show More
Copyright and Terms & Conditions
© 2017. The American Astronomical Society. All rights reserved.

