

Image Details
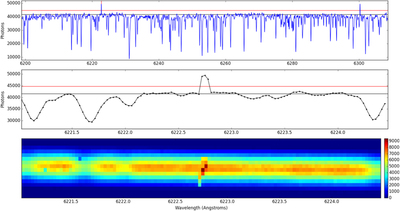
Caption: Figure 4.
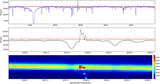
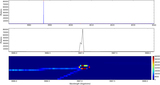
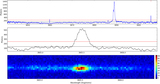
Candidate laser line marked by our search algorithm in HD 5319. The top and middle panels show the entire reduced spectral order in which the candidate was found and a detailed view of the area around the candidate, respectively. The black horizontal lines show the 90th percentile photon count value and the red show the threshold T set by the algorithm. The bottom panel shows the raw CCD image at the same horizontal pixel scale as the middle panel, with corresponding columns. Photons per pixel in the CCD image are denoted by the colorbar on the right. The narrow, diagonal track in the bottom panel indicates that the candidate laser line was caused by a high energy particle or photon piercing the CCD substrate.
Other Images in This Article
Show More
Copyright and Terms & Conditions
© 2017. The American Astronomical Society. All rights reserved.

