

Image Details
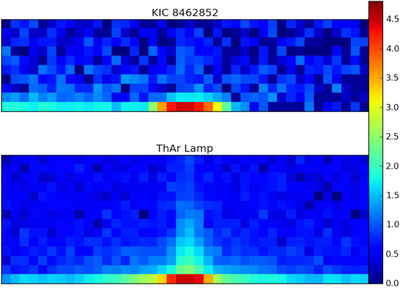
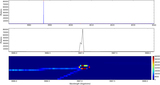
Caption: Figure 7.
Raw CCD images showing the effect of saturation. At the top is the candidate laser line from Tabby’s star, showing the lack of upward spatial extent. This was shown in Figure 6, but here the color of a pixel scales with log10(counts/pixel). At the bottom is a saturated thorium line from a spectrum of the thorium–argon calibration lamp. The counts in the thorium line were scaled (by 10%) so that both the top and bottom plots have the same total counts. Both plots are on the same log scale, with the color code at the right. The thorium lines exhibit an extension of the counts in pixels above and below the center, caused by normal scattering of photons off the cross-disperser diffractional grating. The emission feature in Tabby’s star should exhibit the same extension above and below due to the same scattering of photons. However, such an extension is not there, indicating that the feature in Tabby’s star was not caused by photons passing through the spectrometer. Thus it seems unlikely that this event in the spectrum of Tabby’s star is due to laser emission.
Other Images in This Article
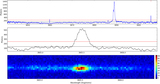
Show More
Copyright and Terms & Conditions
© 2017. The American Astronomical Society. All rights reserved.

