Image Details
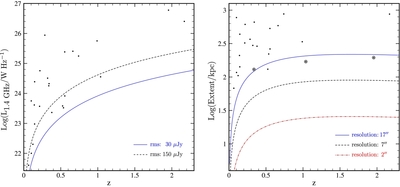
Caption: Figure 5.
Left panel: the rest-frame 1.4 GHz luminosity–redshift relation for the detected BTs. The blue line and black dashed lines represent the 6σ source detection limit with an average rms of 30 and 150 μJy, respectively. Black dots represent the detected BTs in the ATLAS-CDFS. Right panel: the extent–redshift relation for the detected BTs. The blue line, black dashed line, and red dash-dot line represent the detection limit of the sources with an extent of 1.5 beams at 17, 7, and 2 arcsec resolution, respectively. Black dots and circles represent detected BTs and sources that could not be classified as BTs without employing 2'' resolution VLA data, respectively.
Other Images in This Article

Copyright and Terms & Conditions
© 2014. The American Astronomical Society. All rights reserved.