

Image Details
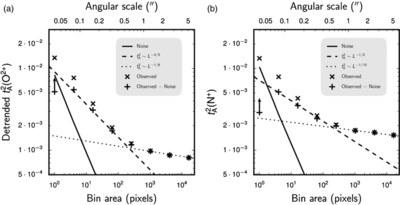
Caption: Figure 9.
Global plane-of-sky temperature fluctuations t 2 A for (a) [O iii] and (b) [N ii] as a function of bin area (lower horizontal axis) or angular scale (upper horizontal axis). Cross symbols show the measured values, while plus symbols show the values after correcting for the expected contribution from noise (indicated by the solid line). The left-most point in each graph is affected by the finite angular resolution of the telescope and hence is only a lower limit to the true t 2 A at that scale. In the case of [O iii], "detrended" temperatures are used, from which the large-scale radial variation has been removed as described in the text.
Other Images in This Article
Copyright and Terms & Conditions
© 2013. The American Astronomical Society. All rights reserved.

