

Image Details
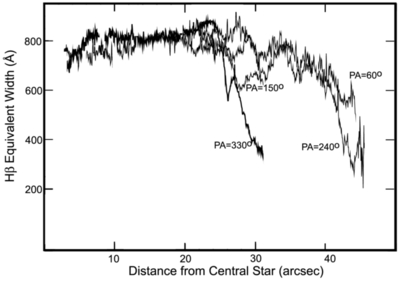
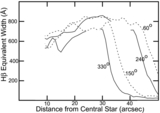
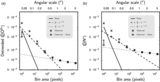
Caption: Figure 6.
Equivalent width of the Hβ emission line and its underlying continuum are shown along the P.A. values 60°, 150°, 240°, and 330° as determined from the WFC3 F547M and F487N images. Decreasing equivalent width values indicate relatively stronger continuum values. Most of the regions contaminated by starlight have been edited out.
Other Images in This Article
Copyright and Terms & Conditions
© 2013. The American Astronomical Society. All rights reserved.

Copyright ©
2026 Astronomy Image Explorer. All Rights Reserved.
