

Image Details
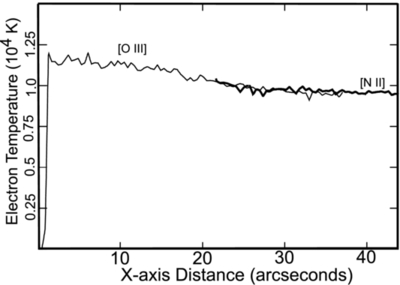
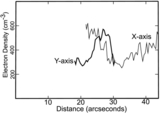
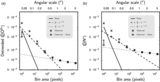
Caption: Figure 3.
T e values derived from both the [N ii] and [O iii] lines are shown for the X-axis profile. The range of results for the two ions was constrained to those where the surface brightness of the nebular transitions were the highest.
Other Images in This Article
Copyright and Terms & Conditions
© 2013. The American Astronomical Society. All rights reserved.

Copyright ©
2026 Astronomy Image Explorer. All Rights Reserved.
