Image Details

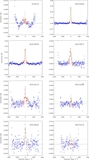
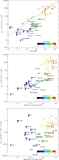
Caption: Figure 5.
CO emission and tracers of star formation. Left column: CO(1–0) intensity as a function of FUV and 24 μm intensity, and a combination of FUV and 24 μm used to determine the SFR. Right column: intensity ratios of CO and FUV or 24 μm as a function of metallicity. Bigger symbols show stacking results for dwarf galaxies derived over the entire galaxy extent (colored symbols) or over 24 μm bright regions (gray symbols). Smaller symbols show azimuthally averaged radial profiles in massive spiral galaxies. CO emission is well correlated with emission of SFR tracers, especially with 24 μm. The ratios CO/FUV and CO/24 μm show systematically smaller values in low-metallicity environments as is typical for dwarf galaxies.
Other Images in This Article
Copyright and Terms & Conditions
© 2012. The American Astronomical Society. All rights reserved.