Image Details
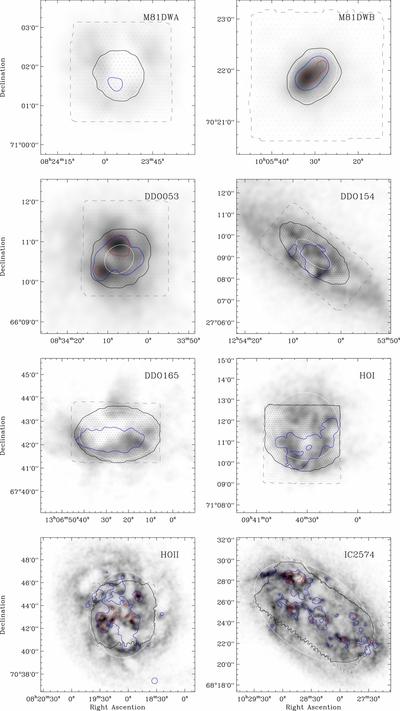
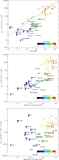
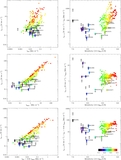
Caption: Figure 1.
Coverage of CO observations. For each HERACLES dwarf galaxy we show the coverage of our CO data (gray dashed line), the H i surface density (gray scale) at linear scale between 0 and 40 M ☉ pc −2, the 24 μm intensity (red contour) at 0.2 MJy sr −1, the FUV intensity (blue contour) at 0.01 MJy sr −1, and a galactocentric radius R = R 25 (white contour). We determine the CO intensity at each sampling point (dot) and stack the data for the "entire" galaxy (black contour) and for IR-bright regions (red contour); see the text for definition of stacking regions.
Other Images in This Article
Copyright and Terms & Conditions
© 2012. The American Astronomical Society. All rights reserved.
Copyright ©
2025 Astronomy Image Explorer. All Rights Reserved.