Image Details
Caption: Figure 2.
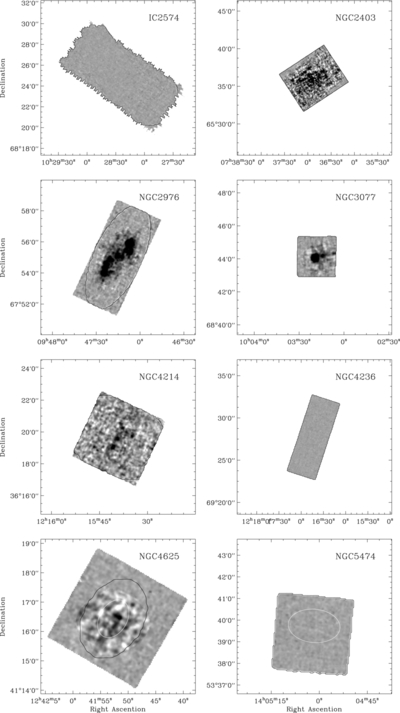
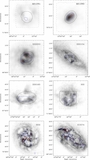
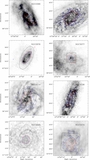
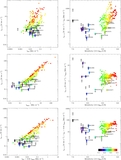
CO intensity maps. Integrated CO(2–1) intensity maps (including all channels with velocities in the range of ±50 km s −1 of the local H i mean velocity) for a subsample of the HERACLES dwarf galaxies at a linear gray scale from −0.3 to 0.7 K km s −1. The galactocentric radius R = R 25 is shown as white contour, the region selected to determine the integrated CO intensity for the entire galaxy as black contour. The remaining HERACLES dwarf galaxies not shown here are non-detections at full resolution.
Other Images in This Article
Copyright and Terms & Conditions
© 2012. The American Astronomical Society. All rights reserved.
Copyright ©
2025 Astronomy Image Explorer. All Rights Reserved.