Image Details

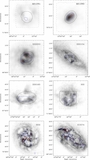
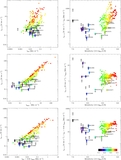
Caption: Figure 3.
Stacked CO spectra. The resulting mean CO(2–1) spectrum after stacking all data over the entire galaxy (or map extent; black contours in Figures 1 and 2). The spectra are shifted to the local mean H i velocity and thus expected to peak at zero velocity (see the text). We fit Gaussian profiles (green lines) to the data within ±50 km s−1 to determine the integrated CO intensity; for stacked spectra without robust signal we determine the 3σ upper limit (green dot-dashed lines). The horizontal dotted lines show the 1σ rms noise of the stacked spectra.
Other Images in This Article
Copyright and Terms & Conditions
© 2012. The American Astronomical Society. All rights reserved.
Copyright ©
2025 Astronomy Image Explorer. All Rights Reserved.