Image Details
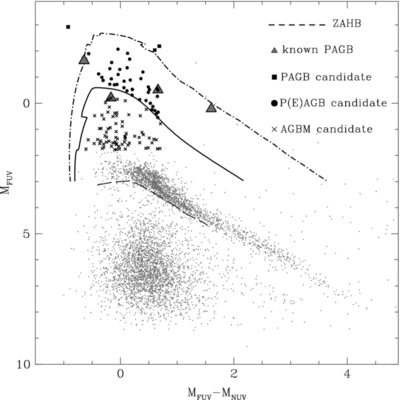
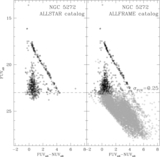
Caption: Figure 15.
Stacked color–magnitude diagram from Figure 14 (gray dots), with theoretical models from Brown et al. (2008) overlaid on the data. The thick solid line represents the post-HB evolutionary path for a star of M = 0.77 M☉, while the dash-dotted line is for an M = 0.515 M☉ star. The dashed model is the ZAHB. The solid squares represent candidate PAGB stars. Large circles are candidate P(E)AGBs and crosses are candidate AGBM stars. Large gray triangles indicate the positions of a few well-known PAGB stars. Note that, while for all the other stellar types photometry is only plotted for stars within the cluster-centric limits shown in Figures 11(a)–(g), photometry is shown for all PAGB stars. See discussion in Section 4.
Other Images in This Article

Show More
Copyright and Terms & Conditions
© 2012. The American Astronomical Society. All rights reserved.
Copyright ©
2025 Astronomy Image Explorer. All Rights Reserved.