Image Details
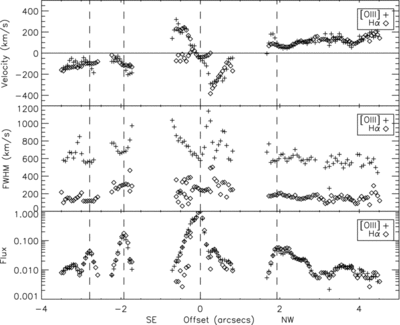
Caption: Figure 2.
[O iii] and Hα plots showing radial velocities (top), FWHM (middle), and normalized total flux (bottom). Dashed lines depict the position of the two southeast arcs, the nucleus, and the single northwest arc. Note the broader features of the [O iii] G430L grating due to the poorer resolution in low dispersion.
Other Images in This Article
Copyright and Terms & Conditions
© 2010. The American Astronomical Society. All rights reserved.
Copyright ©
2025 Astronomy Image Explorer. All Rights Reserved.