Image Details
Caption: Figure 1.
Enhanced contrast 20
![]() 0 × 20
0 × 20
![]() 0 structure map of the
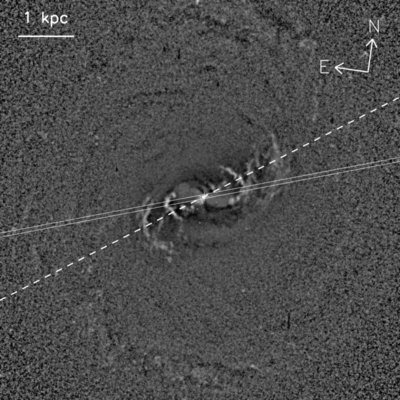
HST WFPC2 image of Mrk 573, obtained with the F606W filter. Bright areas correspond to line emission and dark areas correspond
to dust absorption. Solid lines outline the position of the STIS slit and dashed line depicts the P.A. of the radio components.
0 structure map of the
HST WFPC2 image of Mrk 573, obtained with the F606W filter. Bright areas correspond to line emission and dark areas correspond
to dust absorption. Solid lines outline the position of the STIS slit and dashed line depicts the P.A. of the radio components.
Other Images in This Article
Copyright and Terms & Conditions
© 2010. The American Astronomical Society. All rights reserved.
Copyright ©
2025 Astronomy Image Explorer. All Rights Reserved.