Image Details
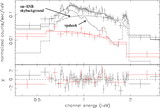
Caption: Fig. 5.
Radial ACIS‐I intensity profile of the central bright feature (crosses with error bars), compared with the ACIS‐I 0.5–8 keV PSF (solid line) at the same position, to show the extension of the feature. The data are exposure‐corrected and were adaptively binned to achieve a count‐to‐noise ratio greater than 3 for the first point and 5 for outer points. The PSF was simulated with MARX (ver. 4.2.1), normalized to the total net flux of the source and is presented together with the adopted local background estimated from the intensity profile in a 1﹩\arcmin﹩–1.5﹩\arcmin﹩ annulus. The dashed line represents a fit to the intensity profile with I = 0.035﹩e^{-r/ 0.1}﹩ ﹩+﹩ 0.0053.
Other Images in This Article
Copyright and Terms & Conditions
© 2007. The American Astronomical Society. All rights reserved. Printed in U.S.A.