Image Details
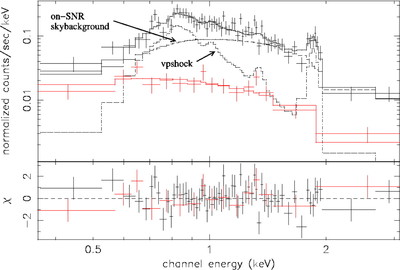
Caption: Fig. 4.
On‐SNR spectra of DA 530 (black) and the local background (red). Also shown are the best‐fit model of the on‐SNR spectrum (solid lines), consisting of the free‐﹩N_{\mathrm{H}\,}﹩ vpshock model (see Table 1; diffuse emission) and a power law (Γ ~ 2; sky background). The two individual components are also plotted separately with dashed lines. The residuals of the fit are shown at the bottom.
Other Images in This Article
Copyright and Terms & Conditions
© 2007. The American Astronomical Society. All rights reserved. Printed in U.S.A.
Copyright ©
2025 Astronomy Image Explorer. All Rights Reserved.