Image Details
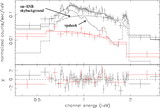
Caption: Fig. 2.
Chandra ACIS‐I intensity image of DA 530 in the 0.5–8 keV band, compared with the intensity contours from the ROSAT PSPC, which are spaced at 1.4, 1.65, 1.9, 2.45, 3, 3.6, 4.1, 5.9, and 30 × 10−5 photons cm−2 s−1 pixel−1. Both intensities have been exposure‐corrected and smoothed using the CIAO tool csmooth to achieve a signal‐to‐noise ratio of 2.5–3.5. The Chandra data are background‐subtracted. The same radio outer boundary (heavy contour) as in Fig. 1 is shown.
Other Images in This Article
Copyright and Terms & Conditions
© 2007. The American Astronomical Society. All rights reserved. Printed in U.S.A.
Copyright ©
2025 Astronomy Image Explorer. All Rights Reserved.