Image Details
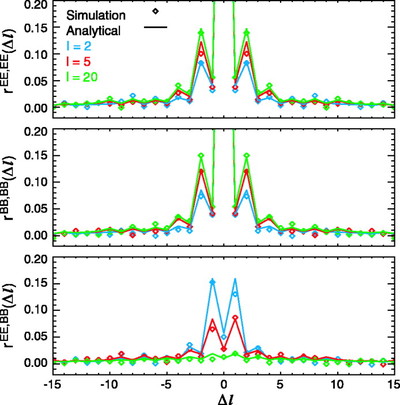
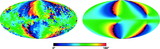
Caption: Fig. 28.
Correlation coefficients of the Fisher matrices. The diamonds are derived from 100,000 Monte Carlo simulations, while the solid lines are the analytical formulae in the noise‐dominated regime. In the simulations, the B mode is noise only, while the E mode has some signals at low l from reionization.
Other Images in This Article
Show More
Copyright and Terms & Conditions
© 2007. The American Astronomical Society. All rights reserved. Printed in U.S.A.
Copyright ©
2025 Astronomy Image Explorer. All Rights Reserved.