Image Details
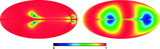
Caption: Fig. 23.
Left: Lines of Δχ2 for the fit given in eq. (28) vs. ﹩A^{\mathrm{EE}\,}﹩. The different colors correspond to different frequency combinations. If the EE prediction from the TT measurements describes the EE measurements, then the minimum would be at ﹩A^{\mathrm{EE}\,}=1﹩. The line at ﹩\Delta \chi ^{2}=1﹩ corresponds to the 1 σ error. One can see that the ﹩l> 50﹩ EE data are consistent with the model. Right: The amplitude and phase of the TE measurement with respect to the model predicted by the TT data. If the TE were completely predicted by the model based on TT, the contours would be consistent with ﹩A^{\mathrm{TE}\,},\ \Delta l^{\mathrm{TE}\,}=( 1,\ 0) ﹩. It is clear that the TT model describes the TE data as well. The reduced χ2 for the best‐fit model is 0.67. To convert ﹩\Delta l﹩ to a phase angle in degrees, multiply by 1.18.
Other Images in This Article
Show More
Copyright and Terms & Conditions
© 2007. The American Astronomical Society. All rights reserved. Printed in U.S.A.