Image Details
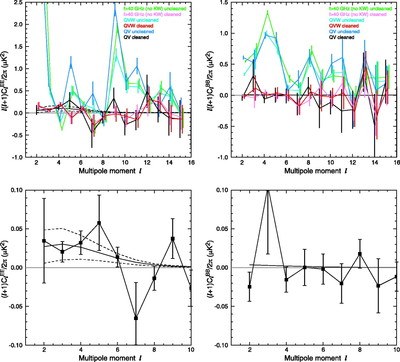
Caption: Fig. 21.
Top: EE and BB power spectra outside the P06 mask before and after applying the KD3Pol foreground model. Different colors show different frequency combinations. Negative values are possible due to anticorrelations between foreground components, and to a lesser degree, from the coupling between different values of ﹩l﹩. Only statistical uncertainties are shown. For EE, the smooth black lines are the best‐fit model to the TT, TE, and EE data. The cosmic variance uncertainty is indicated by the dashed lines. The EE values at ﹩l=2﹩ are 5.8, 4.5, and 5.5 μK2 for ﹩f> 40﹩ (no KW), QVW, and QV combinations, respectively. To clean these to a level of 0.1 μK2 requires cleaning the Stokes Q and U maps to one part in eight. The BB foreground emission is generally less than half the EE emission. Bottom: Expanded plots of the QV data for the P06 cut. The models are for ﹩\tau =0.09﹩ and ﹩r=0.3﹩. The absence of any signal in BB is another indication that foreground emission is not a significant contaminant. Note that the y‐axis of the bottom plot has been divided by one power of ﹩l﹩ relative to the top plot.
Other Images in This Article
Show More
Copyright and Terms & Conditions
© 2007. The American Astronomical Society. All rights reserved. Printed in U.S.A.