Image Details
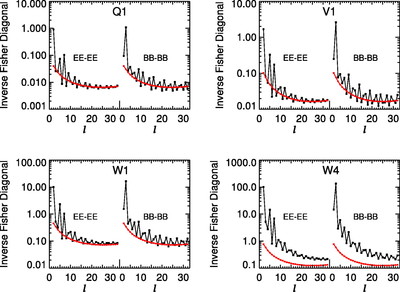
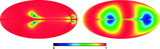
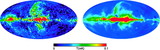
Caption: Fig. 16.
Comparison of the predicted ﹩C_{l}﹩ errors with (black) and without (red) assuming correlated noise in the polarization sky maps. On the y‐axis is plotted the diagonal element of the inverse of the Fisher matrix for 1 year of data. The units are (μK)4. Note that the y‐axis scale for each plot is different. In each panel EE and BB are shown. The variations in the N−1 weighting are due to the scan pattern combined with the sky cut. There is less variation for B modes than there is for E modes. W4 has the largest ﹩1/ f﹩ noise of all radiometers. One can see that the combination of ﹩1/ f﹩ noise coupled with WMAP’s scan strategy leads to a larger uncertainty than one would get from considering just the effects of ﹩1/ f﹩ noise alone.
Other Images in This Article
Show More
Copyright and Terms & Conditions
© 2007. The American Astronomical Society. All rights reserved. Printed in U.S.A.