Image Details
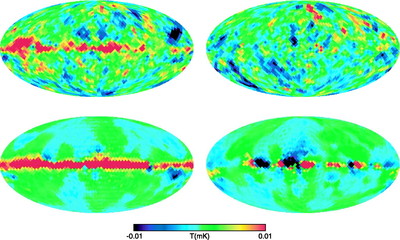
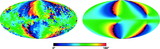
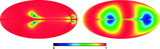
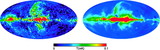
Caption: Fig. 12.
Upper panels show the polarization signal at W band with the CMB and synchrotron signal removed (smoothed with a 10° Gaussian beam). The left and right panels show Stokes Q and U polarization components, respectively. There is a clear preponderance of Stokes Q emission in the plane. The lower panels show the predicted dust polarization based on eq. (15). For ﹩\vert b\vert < 10^{\circ }﹩, the stars do not sample the dust column well and the model is not accurate, especially for Stokes U. For ﹩\vert b\vert > 10^{\circ }﹩, there are regions where the data and model agree to the eye. However, a fit (§ 4.3) is used to assess the level of polarized dust emission in the maps.
Other Images in This Article
Show More
Copyright and Terms & Conditions
© 2007. The American Astronomical Society. All rights reserved. Printed in U.S.A.