Image Details
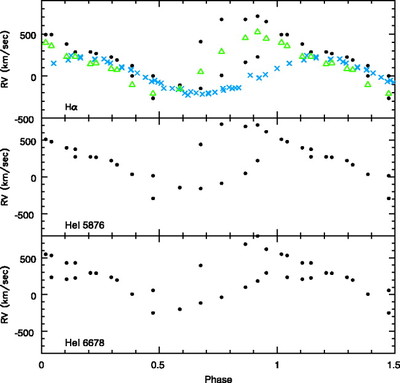
Caption: Fig. 12.
High‐state (2006 May 19 UT) RV curves of ST LMi for Hα (top) and two He I emission lines (middle and bottom). The triangles are velocities of the centroid of Hα. The circles are velocities at the peaks of the most distinct one or two emission‐line components, as seen in the line profiles in Fig. 10. For comparison, the crosses in the top panel are the ST LMi Hα velocities for the low‐state WIYN data of 2006 February 21/22 UT.
Other Images in This Article
Show More
Copyright and Terms & Conditions
© 2007. The American Astronomical Society. All rights reserved. Printed in U.S.A.
Copyright ©
2025 Astronomy Image Explorer. All Rights Reserved.