Image Details
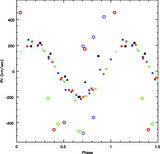
Caption: Fig. 4.
Phased V‐band light curves of ST LMi from 1990–2005 RoboScope data. The data consist of a single point each clear night, at a random orbital phase. Top: High‐state light curve showing a maximum near phase 0.8. Bottom: Low‐state light curve, perhaps showing a weak maximum near phase 0.8. The occasional brightward excursions are likely artifacts due to cosmic rays.
Other Images in This Article
Show More
Copyright and Terms & Conditions
© 2007. The American Astronomical Society. All rights reserved. Printed in U.S.A.
Copyright ©
2025 Astronomy Image Explorer. All Rights Reserved.