Image Details
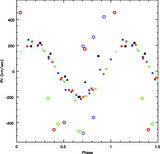
Caption: Fig. 3.
Top: Phased light curve of ST LMi from observing run D, as marked in Fig. 1 (bottom). Note the weakness of the maximum near phase 0.8 compared to Fig. 2 (left), and the near absence of scatter in the light curve compared to Figs. 2 and 4 (bottom). Filled circles are data from the second of two adjacent orbital cycles. Middle and bottom: Phased R‐band light curves of ST LMi. The middle panel is a differential R‐band light curve from run A2, as marked in Fig. 1 (bottom). The bottom panel is a synthetic light curve extracted from the 4 m spectra of 2006 May 19, with an effective wavelength approximately midway between V and R. Note the large amplitude of the maximum near phase 0.8 in both plots.
Other Images in This Article
Show More
Copyright and Terms & Conditions
© 2007. The American Astronomical Society. All rights reserved. Printed in U.S.A.
Copyright ©
2025 Astronomy Image Explorer. All Rights Reserved.