Image Details
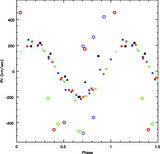
Caption: Fig. 1.
Top: V‐band light curve of ST LMi for 1990–2005 from various sources, mostly RoboScope. The dates of our spectroscopy are noted as vertical dashed lines. Bottom: Expanded view of the latter portion of the top panel, with the spectroscopic observing runs noted. The labeled photometric sequences correspond to the designations in Fig. 2 and Table 1.
Other Images in This Article
Show More
Copyright and Terms & Conditions
© 2007. The American Astronomical Society. All rights reserved. Printed in U.S.A.
Copyright ©
2025 Astronomy Image Explorer. All Rights Reserved.