Image Details
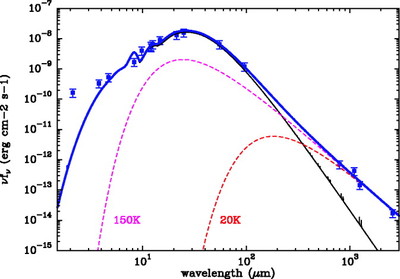
Caption: Fig. 13.
Top: Observed SED of IRAS 18276−1431 corrected by interstellar extinction (squares), SED predicted by CLOUDY for our best‐fit model (thin solid black line), and blackbody spectra for ﹩T_{\mathrm{dust}\,}=150﹩ and 20 K (dashed lines). A combined model spectrum (best‐fit CLOUDY model + 150 K blackbody) is shown with the thick solid blue line. Bottom: Spatial variation of the grain equilibrium temperature for the different grain size bins used in the model (solid black lines). The gas density (blue line), obtained by adopting a constant dust‐to‐gas mass ratio throughout the envelope (﹩\delta =200﹩), and the gas kinetic temperature (pink dashed line), predicted by CLOUDY for the best‐fit envelope parameters derived from SED modeling, are also shown.
Other Images in This Article

Show More
Copyright and Terms & Conditions
© 2007. The American Astronomical Society. All rights reserved. Printed in U.S.A.