Image Details
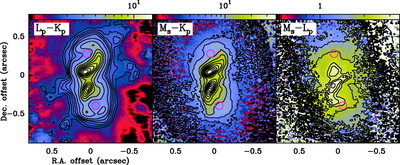
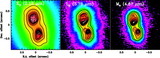
Caption: Fig. 8.
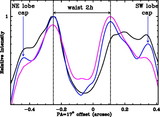
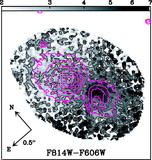
Top: Color maps obtained with the ﹩K_{p}﹩, ﹩L_{p}﹩, and ﹩M_{s}﹩ AO images. The color scale (in a logarithmic strecht) is shown in the wedge at the top of the boxes. Circles indicate the position and size of the small, relatively blue patches used for studying the central illuminating source (§ 5). Bottom: F814W−F606W color map (gray scale); the F814W image (contours) is superimposed.
Other Images in This Article

Show More
Copyright and Terms & Conditions
© 2007. The American Astronomical Society. All rights reserved. Printed in U.S.A.
Copyright ©
2025 Astronomy Image Explorer. All Rights Reserved.