Image Details
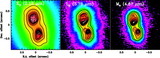
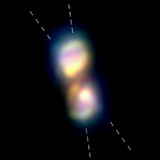
Caption: Fig. 2.
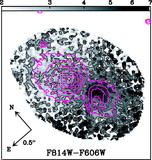
Left: ﹩K_{p}﹩‐band image of IRAS 18276−1431 showing the faint, elongated halo beyond the bipolar lobes. Intensity scale (shown in reverse gray scale) is the same as in Fig. 1. Contour levels are ﹩3\ \sigma \times 2^{i}﹩ for ﹩i=0{\mbox{--}} 11﹩ (﹩\sigma =8\times 10^{-6}﹩ mJy pixel−1; Table 1). The two bright objects at offsets −1.4﹩\arcsec﹩, +1.8﹩\arcsec﹩ (FS1 in the text) and +2.4﹩\arcsec﹩, 0 are not physically associated with IRAS 18276−1431, as indicated by polarization maps of Gledhill (2005). Right: Sharpened version of the image on the left panel to show the searchlight beams and "arcs" of IRAS 18276−1431. The maximum (black) and minimum (gray) values of the displayed logarithmic intensity scale are set at 0.8 and 1.3, respectively. The cross indicates the point where the searchlight beams intersect each other. The center of the image (offset 0, 0) is the center of the halo (see text in § 3.1).
Other Images in This Article

Show More
Copyright and Terms & Conditions
© 2007. The American Astronomical Society. All rights reserved. Printed in U.S.A.