Image Details
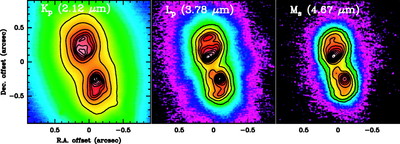
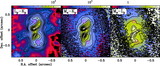
Caption: Fig. 1.
AO images of IRAS 18276−1431 in the ﹩K_{p}﹩, ﹩L_{p}﹩, and ﹩M_{s}﹩ near‐infrared bands. A logarithmic intensity scale, from 3 σ to 95% of the intensity maximum in each image, has been used (see Table 1). Contours are for levels at 5%, and from 10% to 100% of the maximum in each image in 10% steps.
Other Images in This Article

Show More
Copyright and Terms & Conditions
© 2007. The American Astronomical Society. All rights reserved. Printed in U.S.A.
Copyright ©
2025 Astronomy Image Explorer. All Rights Reserved.