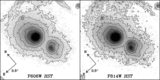
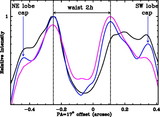
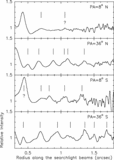
Image Details
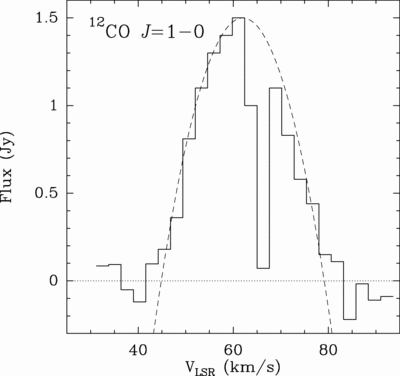
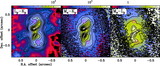
Caption: Fig. 10.
Left: 12CO ﹩J=1{\mbox{--}} 0﹩ spectrum integrated over the nebula (solid line) and parabolic fit to the 12CO profile (dashed line). The 12CO (center) and 13CO (right) intensity maps are integrated over the line profile, i.e., within the LSR velocity range ~[40:80] and [53:59] km s−1, respectively. For 12CO (13CO) levels are −2, 2, ..., σ spaced every ﹩2\ \sigma =3.4﹩ Jy km s−1 (−2, −1, 1, ..., σ spaced every ﹩1\ \sigma =0.6﹩ Jy km s−1).
Other Images in This Article

Show More
Copyright and Terms & Conditions
© 2007. The American Astronomical Society. All rights reserved. Printed in U.S.A.
Copyright ©
2025 Astronomy Image Explorer. All Rights Reserved.