Image Details
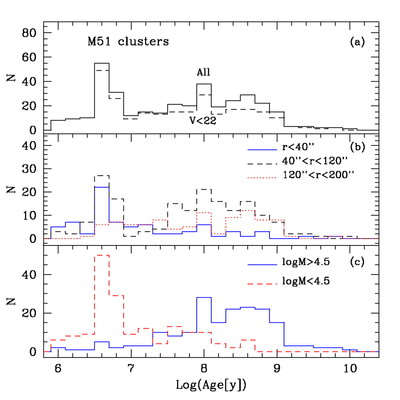
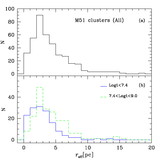
Caption: Fig. 9.
(a) Age distributions of all sample clusters in NGC 5194, as well as those brighter than ﹩V=22﹩ (dashed line). (b) Age distribution at different distances from the center of NGC 5194. (c) Age distribution for two different mass ranges.
Other Images in This Article

Show More
Copyright and Terms & Conditions
© 2005. The American Astronomical Society. All rights reserved. Printed in U.S.A.
Copyright ©
2025 Astronomy Image Explorer. All Rights Reserved.