Image Details
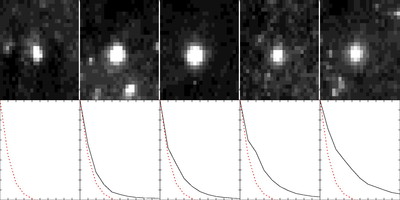
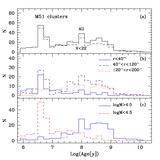
Caption: Fig. 2.
Radial profiles of representative star clusters in M51 compared with a stellar profile. The top left panel shows a star, and the other top panels show example V‐band images of four clusters from our sample. Each image is ﹩2\farcs 5\times 2\farcs 5﹩. Below each object image we have plotted (in arcseconds) its radial profile (solid line), with that of the star (dotted line) shown for comparison.
Other Images in This Article
Show More
Copyright and Terms & Conditions
© 2005. The American Astronomical Society. All rights reserved. Printed in U.S.A.
Copyright ©
2025 Astronomy Image Explorer. All Rights Reserved.