Image Details
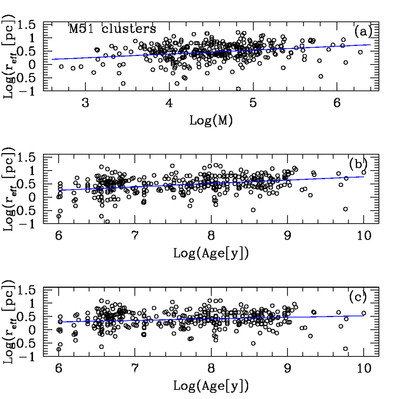
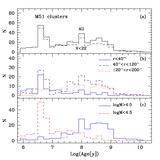
Caption: Fig. 8.
(a) Effective radius of our NGC 5194 cluster sample vs. their derived (log) mass. (b) Effective radius vs. estimated cluster age (log years) for our NGC 5194 cluster sample. (c) Corrected and refitted cluster size distribution for the derived size‐mass relation. The solid lines represent the best linear fits, and the slopes are ﹩0.14\pm 0.03﹩, ﹩0.13\pm 0.02﹩, and ﹩0.06\pm 0.02﹩ for the three panels, respectively.
Other Images in This Article

Show More
Copyright and Terms & Conditions
© 2005. The American Astronomical Society. All rights reserved. Printed in U.S.A.
Copyright ©
2025 Astronomy Image Explorer. All Rights Reserved.