Image Details
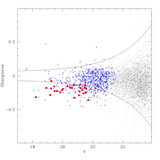
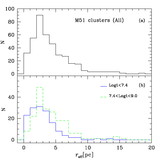
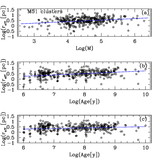
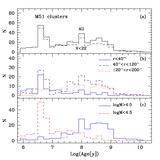
Caption: Fig. 10.
Top: Estimated age vs. mass for star clusters discussed in this paper for M51 and for a sample of star clusters detected in a deep HST WFPC2 image of M101 (R. Chandar et al. 2005, in preparation). The middle and bottom panels show the age distributions for the M51 and M101 cluster systems, as well as a linear fit at ages of ﹩7.5< \mathrm{log}\,[ \mathrm{age}\,\ ( \mathrm{yr}\,) ] < 9.5﹩. The plots show the excess of intermediate‐age clusters in M51 relative to those in M101 (which is believed to have had a more quiescent formation history).
Other Images in This Article

Show More
Copyright and Terms & Conditions
© 2005. The American Astronomical Society. All rights reserved. Printed in U.S.A.
Copyright ©
2025 Astronomy Image Explorer. All Rights Reserved.