Image Details
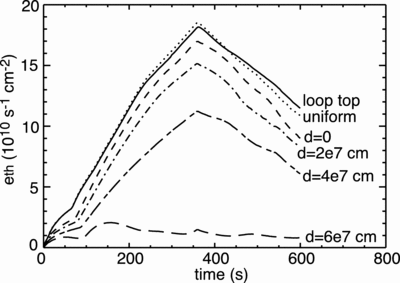
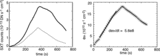
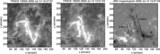
Caption: Fig. 12.
Temporal variation of eth in the simulations with various flare heating functions. Plotted are the loop‐top heating, the uniform heating, and the footpoint heating with ﹩d=( 0,2,4,6) \times 10^{7}﹩ cm, which are indicated in the figure.
Other Images in This Article

Show More
Copyright and Terms & Conditions
© 2005. The American Astronomical Society. All rights reserved. Printed in U.S.A.
Copyright ©
2025 Astronomy Image Explorer. All Rights Reserved.