Image Details
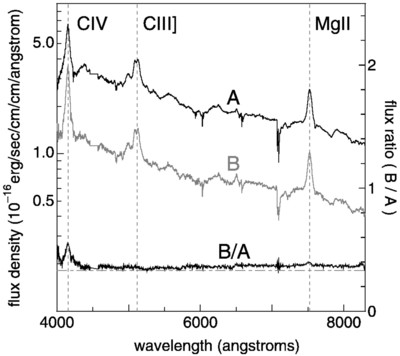
Caption: Fig. 6.
Binned spectra of SDSS J0246−0825 components A (black solid line) and B (gray solid line) taken with ESI on Keck II. The vertical gray dotted lines (4154.6, 5119.2, and 7506.2 Å) represent the positions of the emission lines redshifted to ﹩z=1.682﹩ of C IV λ1549.06, C III] λ1908.73, and Mg II λ2798.75, respectively. We find both components have C IV, C III], and Mg II emission lines at the same redshift (﹩z=1.68﹩). The bottom thin black solid line represents the spectral flux ratio between components B and A. The gray horizontal dot‐dashed line represents the mean flux ratio (0.33) found in ugri photometry of the WB 6.5 m images. The spectral flux ratio is almost constant and consistent with the photometric flux ratio. The data between 4460 and 4560 Å were excluded due to the existence of bad columns.
Other Images in This Article
Show More
Copyright and Terms & Conditions
© 2005. The American Astronomical Society. All rights reserved. Printed in U.S.A.