Image Details
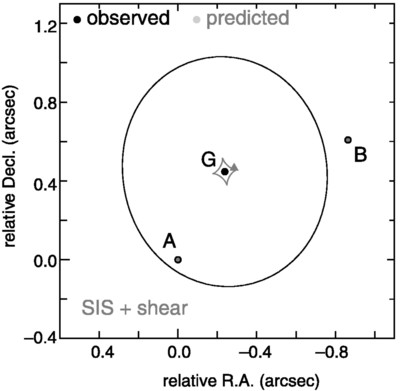
Caption: Fig. 10.
Critical curve (black lines) and caustics (gray lines) of the best‐fit SIS + shear model (left) and SIE model (right). The black filled circles represent the observed positions of the two lensed components (components A and B) and the lensing galaxy (component G). The gray filled circles represent the positions of the lensed components predicted by each mass model. The gray filled triangles are the predicted source quasar positions. The best‐fit parameters for the SIS + shear model are ﹩\alpha _{\mathrm{E}\,}=0\farcs 553﹩, ﹩\gamma =0.067﹩, and ﹩\theta _{\gamma }=10\fdg 147﹩, with the source quasar position at ﹩( \Delta \mathrm{R.A.}\,,\ \Delta \mathrm{decl.}\,) =( -0\farcs 285,\ 0\farcs 466) ﹩ relative to component A. The best‐fit parameters for the SIE model are ﹩\alpha _{\mathrm{E}\,}=0\farcs 554﹩, ﹩e=0.212﹩ (﹩q=0.788﹩), and ﹩\theta _{e}=10\fdg 190﹩, with the source quasar position at ﹩( \Delta \mathrm{R.A.}\,,\ \Delta \mathrm{decl.}\,) =( -0\farcs 299,\ 0\farcs 469) ﹩ relative to component A. Although the degrees of freedom are 0 in these models, both mass models were not able to reproduce the observed flux ratio between components B and A.
Other Images in This Article
Show More
Copyright and Terms & Conditions
© 2005. The American Astronomical Society. All rights reserved. Printed in U.S.A.