Image Details
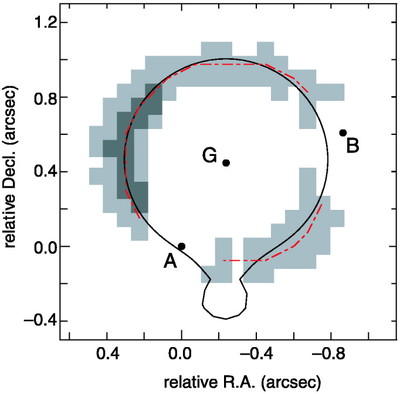
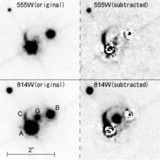
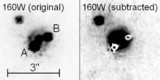
Caption: Fig. 12.
Comparison of the "ring" with the critical curve of the best‐fit model. The solid line represents the critical curve predicted by the two SIS lens model with ﹩\alpha _{\mathrm{E}\,}( \mathrm{G}\,\prime ) =0\farcs 07﹩. The deep gray squares represent the pixels with higher count rate, after subtracting the central lensing galaxy and excluding the pixels around components A and B. The red dot‐dashed line connects the pixels that have the maximum count rate in each column. The ring is in good agreement with the critical curve; this fact supports the idea that the ring is the lensed host galaxy of the source quasar.
Other Images in This Article
Show More
Copyright and Terms & Conditions
© 2005. The American Astronomical Society. All rights reserved. Printed in U.S.A.