Image Details
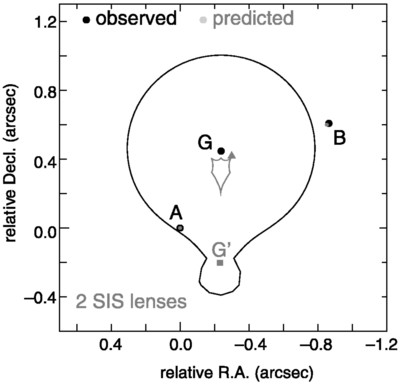
Caption: Fig. 11.
Critical curve (black line) and caustics (gray line) of the two SIS lens model with ﹩\alpha _{\mathrm{E}\,}( \mathrm{G}\,^{\prime }) =0\farcs 07﹩. The gray filled square represents the position of the predicted second lensing object G′. The best‐fit parameters of this model are ﹩\alpha _{\mathrm{E}\,}=0\farcs 525﹩ for component G, with the predicted position of G′ at ﹩( \Delta \mathrm{R.A.}\,,\ \Delta \mathrm{decl.}\,) =( -0\farcs 232,\ -0\farcs 202) ﹩ and the source quasar position at ﹩( \Delta \mathrm{R.A.}\,,\ \Delta \mathrm{decl.}\,) =( -0\farcs 300,\ 0\farcs 418) ﹩ relative to component A. This model reproduces the observed flux ratio, ﹩\mathrm{B}\,/ \mathrm{A}\,=0.33﹩.
Other Images in This Article
Show More
Copyright and Terms & Conditions
© 2005. The American Astronomical Society. All rights reserved. Printed in U.S.A.