Image Details
Caption: Fig. 4.
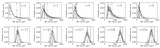
Easy‐to‐use representation for evaluating theoretical models of the power spectrum at the lowest ﹩\ell ﹩. We plot the probability ﹩P( C^{\,\mathrm{theory}\,}_{\ell }< C_{\ell }) ﹩ against ﹩\ell ( \ell +1) C_{\ell }/ 2\pi ﹩ for the largest angular scales probed by WMAP. Theorists can evaluate the goodness of fit of their model ﹩C_{\ell }﹩ with the WMAP data by reading off the probability from this graph. If P is within 0.025 of 1 or 0, the model would be ruled out at the 5% level based on that ﹩\ell ﹩ alone. The vertical dotted line is the WMAP best‐fit theory assuming a constant scalar spectral index ﹩n_{s}﹩. The probability is ~90% that the actual theory ﹩C_{2}﹩ is smaller.
Other Images in This Article
Copyright and Terms & Conditions
© 2004. The American Astronomical Society. All rights reserved. Printed in U.S.A.