Image Details
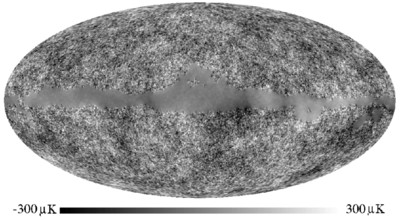
Caption: Fig. 1.
Posterior mean ﹩\langle \boldsymbol{s}\rangle _{P( \boldsymbol{s}\vert \boldsymbol{d}) }﹩ of the CMB signal ﹩\boldsymbol{s}﹩ given the WMAP first‐year data, including all 8 channels in the Q, V, and W bands. This map represents the CMB signal content of the WMAP data. It contains detail where the data warrants it and is smooth where the data are poor. For example, the algorithm is able to reconstruct the largest scale modes in the Galactic plane based on the signal phases and correlations it discovers in regions of the map outside the Galactic plane. The smallest scale that can be reproduced in the Galactic plane is set by the mask size and is a natural consequence of Wiener filtering.
Other Images in This Article
Copyright and Terms & Conditions
© 2004. The American Astronomical Society. All rights reserved. Printed in U.S.A.