Image Details
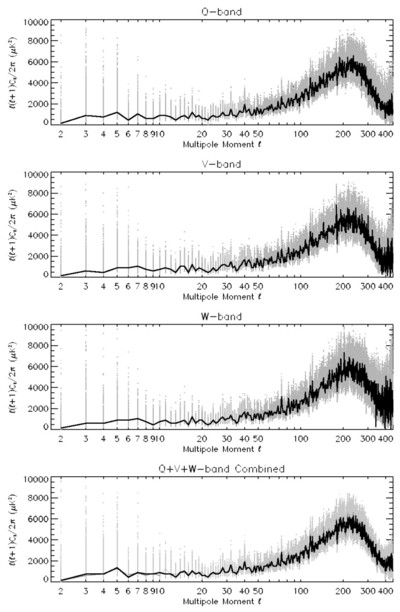
Caption: Fig. 2.
Four power spectra obtained from the Gibbs sampling algorithm. From top to bottom: Q‐, V‐, and W‐band power spectra and finally the combined analysis from all eight cosmologically interesting WMAP channels. Gray dots represent the individual samples, and the dark line is the mode of the unbinned power spectrum. The lighter gray line in the bottom panel is the WMAP combined CMB power spectrum, and where the line is not visible the difference between our result and the original WMAP result is less than the width of the line. The Q and Q+V+W result was obtained with an initial power spectrum based on the WMAP best‐fit power spectrum with a random component, while the V and W results were obtained using an initial spectrum proportional to ﹩1/ \ell ( \ell +1) ﹩. Our V and W results were obtained using the conservative Kp0 mask, while our Q‐band result uses the Kp2 mask. This was done to assess potential foreground contamination, which we find no evidence of.
Other Images in This Article
Copyright and Terms & Conditions
© 2004. The American Astronomical Society. All rights reserved. Printed in U.S.A.