Image Details
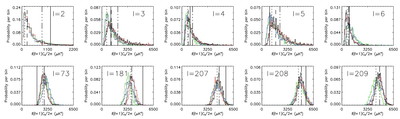
Caption: Fig. 3.
Probability distributions of the ﹩C_{\ell }﹩ samples for a selected set of ﹩\ell ﹩ giving the probability of obtaining a value of ﹩C_{\ell }﹩ within a given histogram bin. We plot results for the significantly non‐Gaussian low‐﹩\ell ﹩ multipoles and for selected higher values based on their deviation from the best‐fit ΛCDM model. There are 50 bins in each histogram. Red, green, and blue histograms are the Q, V, and W bands, respectively. Black is the combined QVW analysis. The dotted vertical line is the WMAP best estimate of the ﹩C_{\ell }﹩ value. The solid line is the WMAP best‐fit theory ﹩C_{\ell }﹩’s, and the dash‐dotted line is the average of the samples from our algorithms. For ﹩\ell < 7﹩, the dashed lines show the WMAP‐ILC values from Efstathiou (2004) for comparison. Further plots are available at http://www.astro.uiuc.edu/~iodwyer/research#wmap.
Other Images in This Article
Copyright and Terms & Conditions
© 2004. The American Astronomical Society. All rights reserved. Printed in U.S.A.