Image Details
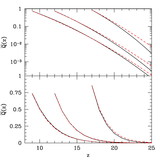
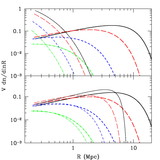
Caption: Fig. 6.
Power spectra at ﹩z=15﹩ (top) and ﹩z=13﹩ (bottom), assuming that ﹩\zeta =40﹩. In each panel, the solid, dashed, dotted, and dot‐dashed curves show Pψ, Pxx, ﹩\overline{x}^{2}_{\mathrm{H}\,}P_{\delta \delta }﹩, and ﹩\vert P_{x\delta }\vert ﹩, respectively. (Note that the xH and density fields are anticorrelated, so ﹩P_{x\delta }< 0﹩.)
Other Images in This Article


Show More
Copyright and Terms & Conditions
© 2004. The American Astronomical Society. All rights reserved. Printed in U.S.A.
Copyright ©
2025 Astronomy Image Explorer. All Rights Reserved.