Image Details

Caption: Fig. 1.
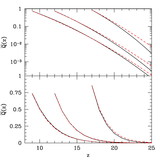
Density threshold ﹩\delta _{x}( \sigma ^{2},z) ﹩ at several different redshifts, assuming ﹩\zeta =40﹩. The curves are for ﹩z=20﹩, 16, and 12, from top to bottom. Within each set, the solid curve is the true ﹩\delta _{x}( m,z) ﹩ and the dashed line is the fit ﹩B( m,z) ﹩.
Other Images in This Article


Show More
Copyright and Terms & Conditions
© 2004. The American Astronomical Society. All rights reserved. Printed in U.S.A.
Copyright ©
2025 Astronomy Image Explorer. All Rights Reserved.