Image Details
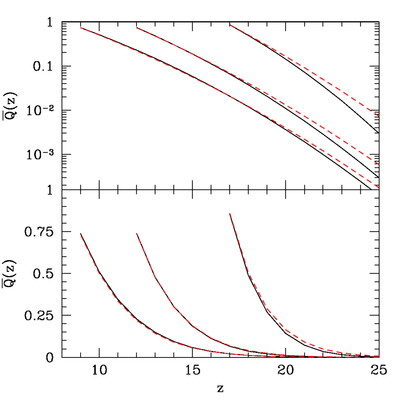
Caption: Fig. 3.
Global ionization history for several scenarios. The curves that rise from zero assume ﹩\zeta =500﹩, 40, and 12, from right to left; solid lines are for our model, and dashed lines are the "true" values, ζfcoll.
Other Images in This Article


Show More
Copyright and Terms & Conditions
© 2004. The American Astronomical Society. All rights reserved. Printed in U.S.A.
Copyright ©
2025 Astronomy Image Explorer. All Rights Reserved.