Image Details

Caption: Fig. 4.
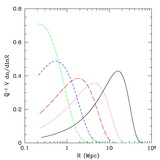
Bubble size distribution ﹩Vdn/ d\mathrm{ln}\,R﹩ at several different redshifts, assuming ﹩\zeta =40﹩. In both panels, the thick lines show our model with dot‐dashed, short‐dashed, long‐dashed, and solid lines corresponding to ﹩z=18﹩, 16, 14, and 13, respectively. In the top panel, the thin lines assume individual galaxies source distinct H II regions. In the bottom panel, the thin lines use eq. (9), with ﹩L_{\mathrm{box}\,}=10﹩ h−1 ﹩\mathrm{Mpc}\,=14.3﹩ Mpc.
Other Images in This Article


Show More
Copyright and Terms & Conditions
© 2004. The American Astronomical Society. All rights reserved. Printed in U.S.A.
Copyright ©
2025 Astronomy Image Explorer. All Rights Reserved.